Gemeente Eindhoven weather
Gemeente Eindhoven weather today. Showers radar with live precipitation radar, lightning radar and current temperature. The darker the radar images, the more intense the precipitation. Follow the direction, speed and intensity of current showers.
Location of Gemeente Eindhoven
Weather Warnings
Code green: no warnings | Code yellow: chance of dangerous weather | Code Orange: chance of extreme weather | Code red: weather alert!
Quick links:
Weather report with weather forecast Gemeente Eindhoven
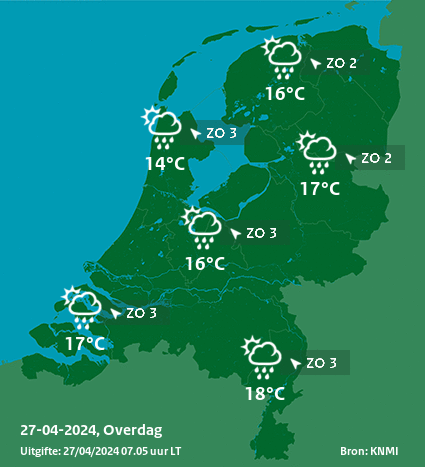
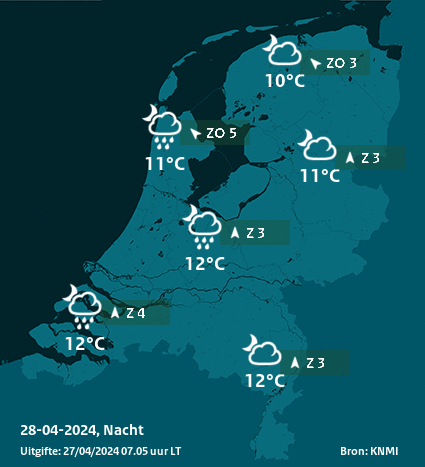
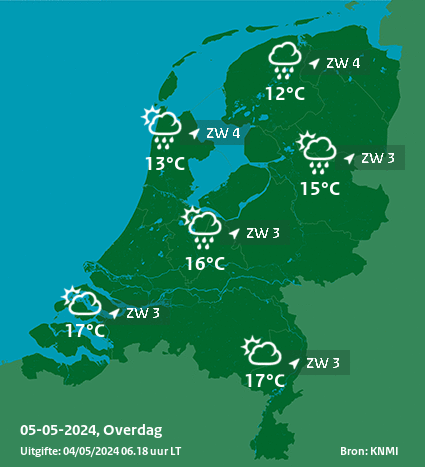
Weather Gemeente Eindhoven for the coming days. The first image shows the weather forecast for today, the second map the forecast for tonight and the third map the weather forecast for tomorrow. Each weather map shows the temperature and the wind direction with wind force for each region in the country. The icon indicates or what type of weather is expected such as cloudy, rain, fog, thunderstorm and sun.
Weather today
Tonight
Weather forecast tomorrow
Extended precipitation radar and rainfall radar
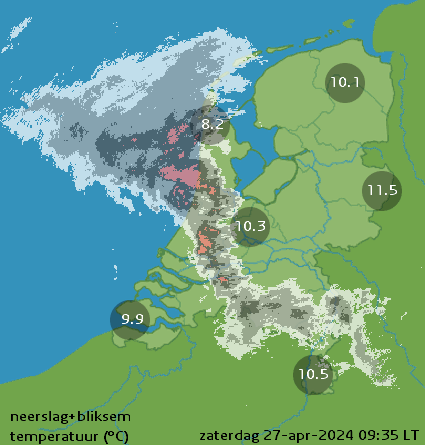
The live images with the Gemeente Eindhoven show precipitation that is currently active. The darker the radar images, the more intense the showers. The image is refreshed every five minutes. This rain radar shows the direction of the showers. You can also see what the current temperature is.
Current images precipitation and intensity
Track direction, speed and intensity of current showers. This precipitation radar displays precipitation and lightning but not current cloud cover. The actual cloud cover can be viewed via the satellite images of the drizzle radar.
Thunder and lightning. Will there be thunder?
Thunderstorms occur when there is friction between strongly rising warm air and rapidly descending cold air. On the thunderstorm radar below with precipitation, lightning and temperature you can see the current lightning activity over the Netherlands and part of Belgium.
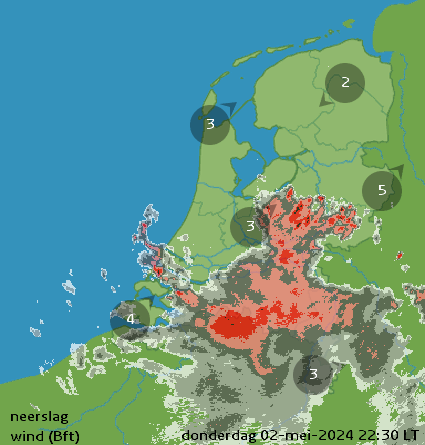
KNMI precipitation radar with wind force (bft)
Drizzle Radar

Satellite and cloud radar

Weather warning Netherlands
View current weather warnings for Gemeente Eindhoven of today and tomorrow. If the map is green, there are no warnings. These warnings come from KNMI. KNMI issues warnings for rain, sleet and snow, thunderstorms, wind gusts, heat and cold, visibility and hail.
Today
Tomorrow
Code green: nothing to worry about
Code green indicates that there are no details to report. There is no need for a warning.
Code yellow: be alert and keep an eye on the weather
With code yellow you should keep a close eye on the weather. There is a chance of dangerous weather. When you go on the road, prepare yourself. Code yellow can be issued 48 hours in advance.
Code orange: chance of dangerous and extreme weather
With code red, there is a chance of extreme or dangerous weather. You should prepare for the bad weather by, for example, securing things to your home, not going out, and having protective clothing ready. At code orange there is a chance of damage, injury and inconvenience. Code orange can occur very locally and is issued 24 hours in advance.
Code red: weather alert! Be prepared
Code red indicates a weather alert which can have a major impact on society. Code red can cause a lot of damage, injuries and inconvenience. Code red is issued at the earliest 12 hours before it occurs.
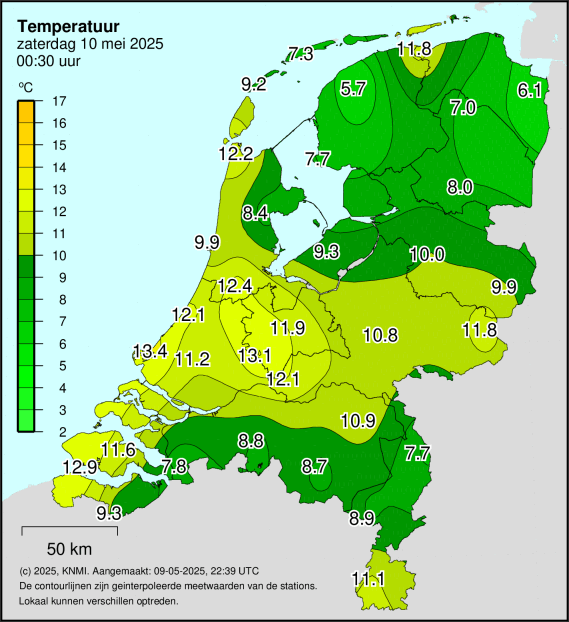
Temperature Gemeente Eindhoven today and tomorrow
The map below shows today's temperature in Gemeente Eindhoven. The contour lines are the values of the different weather stations. Locally there may be small differences. The darker the color, the warmer it is.
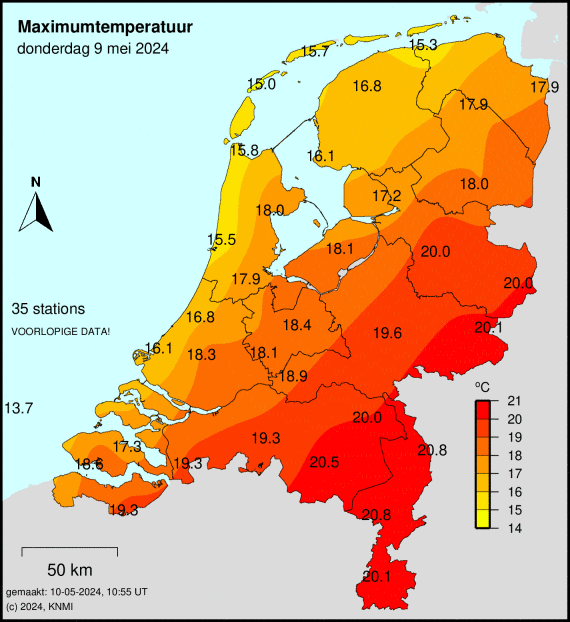
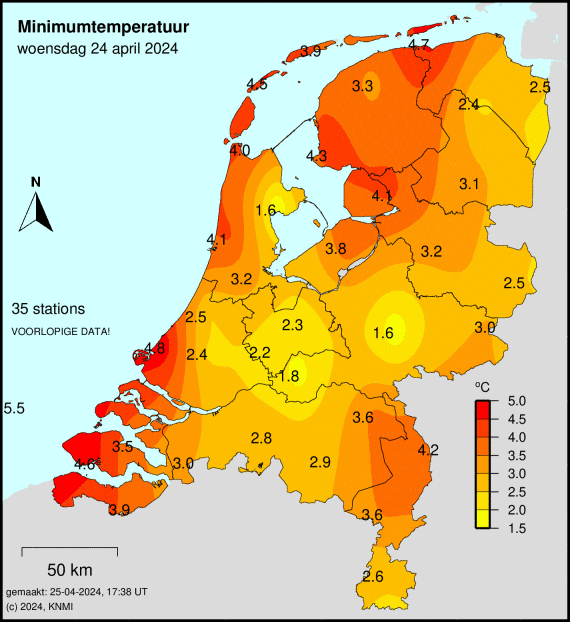
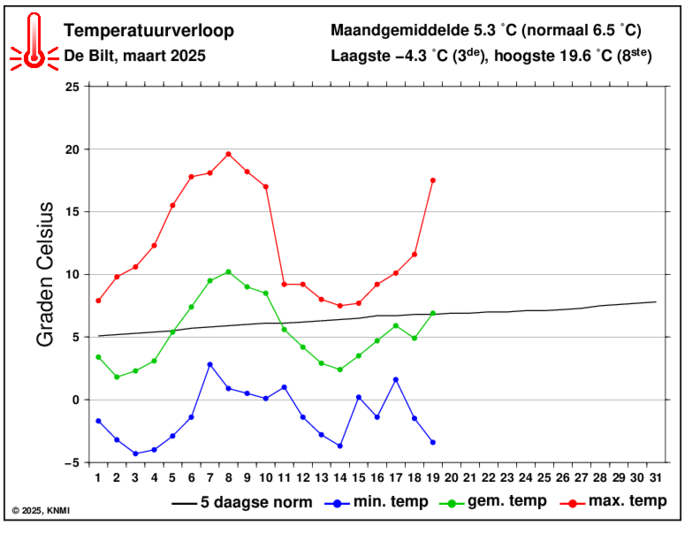
On the maps below you can see the current temperature in the Netherlands. You can also see the temperature development in De Bilt of this month. The red line indicates the maximum temperature per day. The blue line indicates the minimum temperature (usually around sunrise). The green line shows the average of the green and blue line.
Temperature today
Maximum temperature
Minimum temperature
Heat wave or cold wave?
A heat wave occurs when there are at least 5 summer days in De Bilt of 25 degrees Celsius or higher and three of these days have to be tropical. Tropical days are days when it is hotter than 30 Degrees Celcius.
When there are five ice days (maximum temperature should be lower than 0 Degrees Celcius) in De Bilt with three days of hard frost, we speak of a cold wave. It is severe frost when the minimum temperature is lower than minus 10 degrees Celcius.
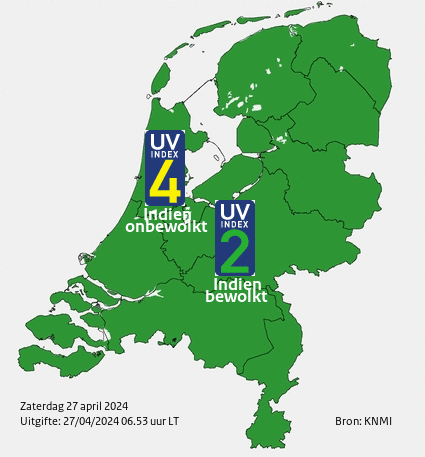
Sun radar and UV index
The maps below show the UV index and sun strength for today and tomorrow. The index is shown when it is cloudy and when it is cloudless. The UV index can vary from 0 to 8 in our country.
Sun power scale
- Sun strength1 1-2: With a sun strength of 1-2, the skin will not burn easily. You can then spend 50-100 minutes in the sun with unprotected skin just fine.
- Sun strength 3-4: Your skin is less likely to burn. You could spend about 25-35 minutes in the sun with your skin unprotected.
- Sun strength 5-6: Your skin can burn quite quickly. You can spend up to 10-15 minutes in the sun with unprotected skin.
- Sun strength 7-8: your skin can burn very quickly. You can spend less than 10 minutes in the sun with unprotected skin, according to the KWF Cancer Society.
Sun power and UV index today
Sun strength and UV index tomorrow

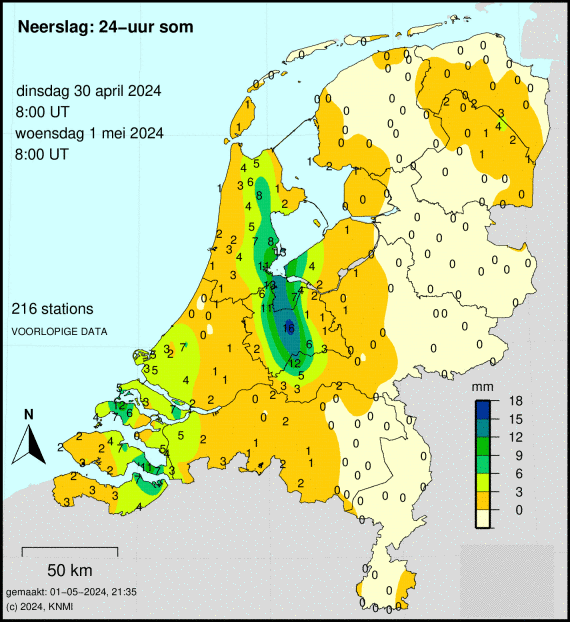
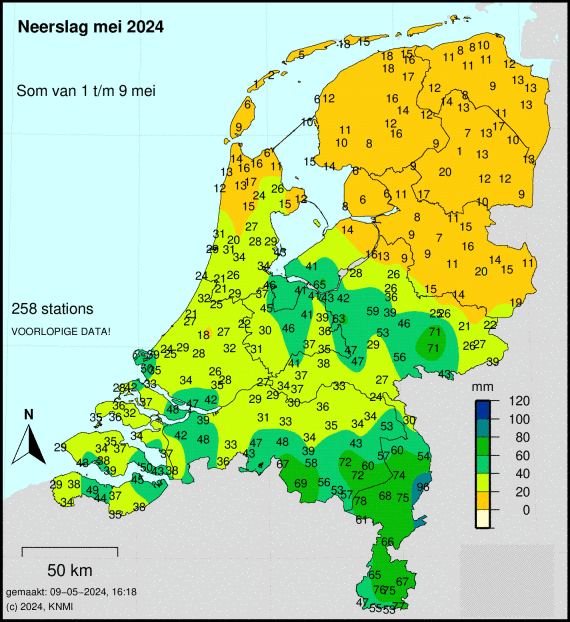
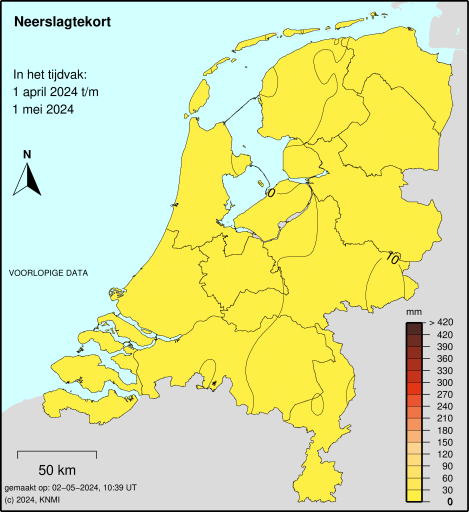
Precipitation Gemeente Eindhoven: 24-hour sum and this month
On the map below you will find the precipitation sum of the last 24 hours in Gemeente Eindhoven. In the other precipitation map you will find the precipitation sum of the past month.
Meaning of the maps
The 24-hour precipitation map shows the precipitation per location with the number of millimeters. The darker the color, the more precipitation fell during the past day. The monthly overview shows the number of millimeters per location per month. The monthly overview shows the sum of the current month. The number of days is shown in the map.
Precipitation: 24-hour sum
Precipitation last month
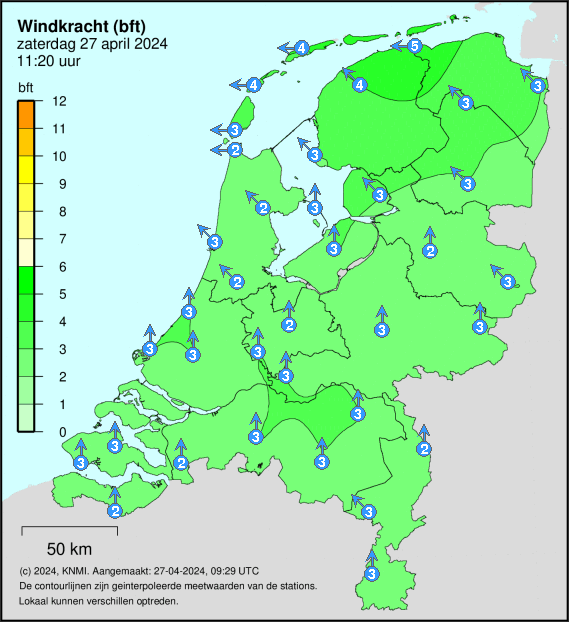
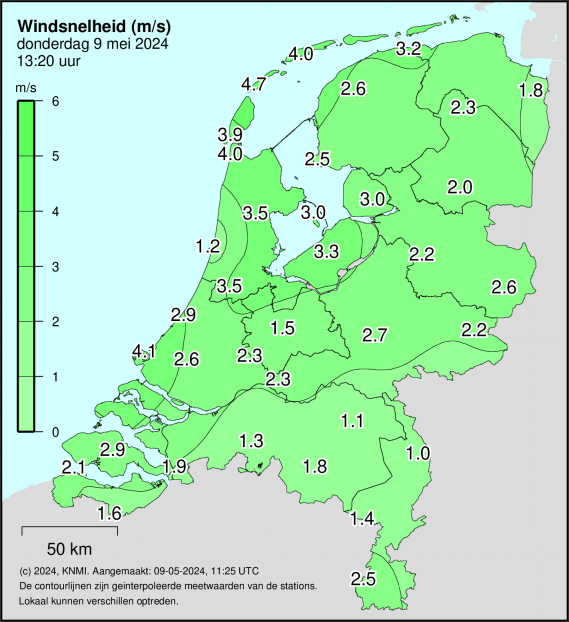
Wind Radar Gemeente Eindhoven
The maps below show the wind force, gusts and wind speed in Gemeente Eindhoven. The values are updated every 10 minutes. Wind force is shown in Beaufort (bft), gusts in kilometers per hour and wind speed in meters per second.
Wind force (bft)
Wind gusts (km/hr)

Wind speed (m/s)
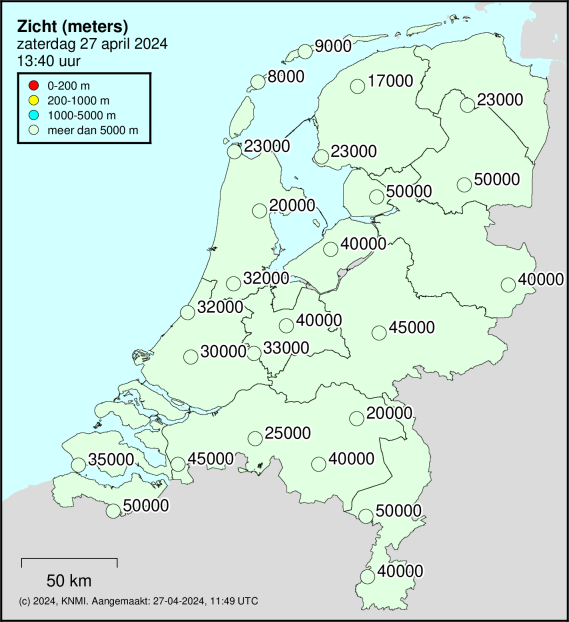
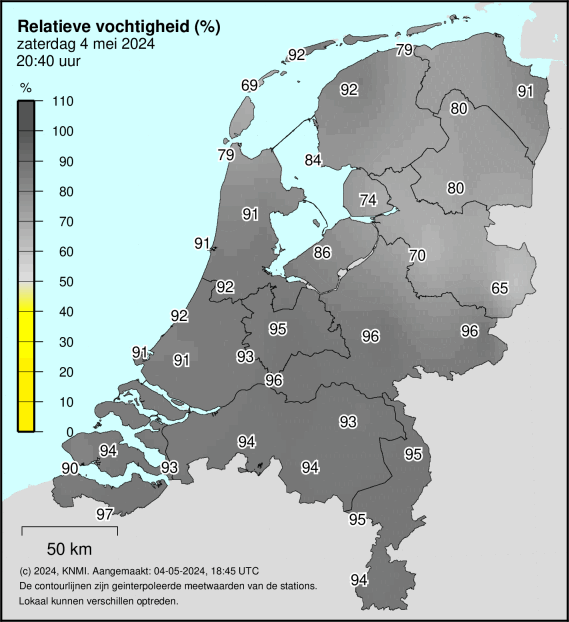
Visibility and humidity
The images below show today’s visibility in meters. And the relative humidity percentage.
Visibility (meters)
With a red dot, visibility is less than 100 meters. A yellow dot indicates visibility of 200-1000 meters. A light blue dot indicates visibility between 1000 and 5000 meters. A blank dot indicates that visibility is more than 5000 meters. It is then completely clear visibility.
Visibility (meters)
The relative humidity percentage is given in percentages. Relative humidity is a ratio that indicates how much water vapor air contains relative to the maximum amount of water vapor the air can contain. A value of 100% indicates the maximum amount of water vapor: the air is then saturated.
View in meters
Relative humidity in %
Drying Monitor
Overview of precipitation and evaporation in the Netherlands. Since evaporation is negligible in the fall, it is not shown.
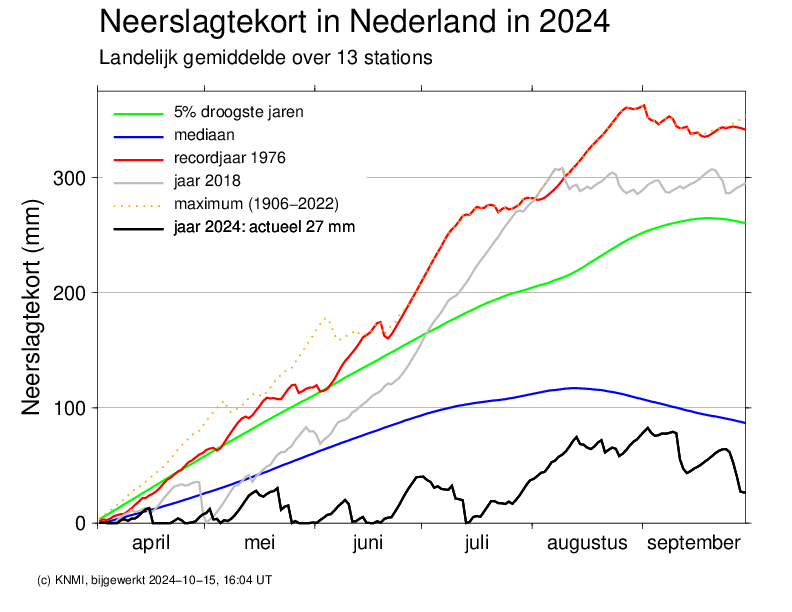
Precipitation deficit
The precipitation deficit indicates the number of millimeters of rainfall deficit. The darker the color, the greater the deficit and the worse the drought. The precipitation deficit is the difference between evaporation and precipitation.
Relative humidity
The relative humidity percentage indicates the amount of humidity in the air. The relative humidity indicates the amount of water vapor in the air relative to the maximum water vapor. At 100%, the air is saturated. The warmer the air, the more water vapor.
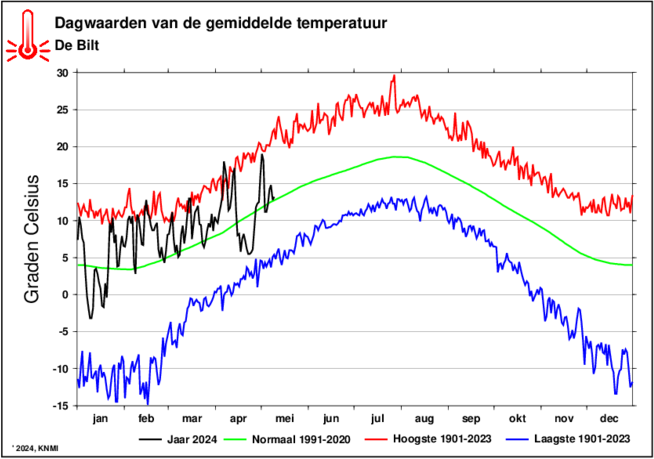
Climate
Overview of the climate in Gemeente Eindhoven. View the average values of temperature in Degrees Celsius over the past 120 years in the chart below.
Climate with average temperature per month
The graph below shows the daily values of the average temperature. The highest average temperature ever measured between 1901 and 2020 is shown by the red, upper line. The black line contains the average temperature for the past (current) year. The green line is the average for the past year and also shows the expected average temperature for the coming months. The blue line shows the minimum temperature in Degrees Celsius over the past century.
Definition
Below is an explanation of some weather terms.
Wind force
Wind force indicates wind speed. The Beaufort (Bft.) scale is used to express wind power. The wind force ranges from wind force 1 to wind force 12. The wind speed is determined during the day and on open terrain. As a result, the wind force is an average. If it is wind force 4, then it may be wind force 6 at sea but wind force 3 on sheltered land. Wind force 1 and 2 represents a weak wind. Wind force 3 and 4 represents a moderate wind. Wind force 5 is a fairly strong wind. At 6 Bft, the wind can be called powerful. A hard wind is the 7 Bft. When it is 8 Bft., the wind is stormy. A wind force further (9 Bft.) is storm. 10 Bft. is a heavy storm. At wind force 11 we speak of a very heavy storm. A hurricane is when it is 12 Bft.
Wind direction
The wind can blow from different directions. These wind directions are North (N), East (O), South (Z) and West (W). Combinations are possible. Example: ZO stands for a wind direction from the southeast. If no clear direction is determined, this is indicated by VAR. With a north wind, wind from the Wadden Sea flows into the Netherlands.
Minimum temperature
The precipitation amount indicates how much precipitation will fall in the form of (drizzle) rain, snow or hail. The precipitation amount is an expectation of precipitation. Precipitation is expressed in millimeters (mm). A millimeter of rain corresponds to 1 liter of rain per square meter of ground surface. For other precipitation, meltwater determines the amount of precipitation.
Afternoon temperature
The afternoon temperature means the highest value in degrees Celsius (°C), which is reached at noon. The afternoon temperature is measured, like the minimum temperature, at 1.5 meters height. When the sun is shining and it is warm, the maximum temperature closer to the ground is often higher. During winter time, the maximum temperature is measured at 15:00 and during summer time at 16:00 or 17:00.
Precipitation amount
The precipitation amount indicates how much precipitation will fall in the form of (drizzle) rain, snow or hail. The precipitation amount is an expectation of precipitation. Precipitation is expressed in millimeters (mm). A millimeter of rain corresponds to 1 liter of rain per square meter of ground surface. For other precipitation, meltwater determines the amount of precipitation.
Precipitation probability
When it comes to the probability of precipitation, it is about the probability as a percentage that precipitation will occur at a particular location. It is not about how long the precipitation falls. For example, it could drizzle for 10 minutes or it could drizzle for 3 hours. If there is a 10% chance of precipitation then the chance is small and if there is a 90% chance of precipitation then the chance is high.
Sunshine percentage
The sunshine percentage gives you an idea of how long the sun shines each day. The sunshine percentage indicates how long the sun shines between sunrise and sunset. For example, if a day lasts 8 hours and the sunshine percentage is 50%, then the sun shines for 4 hours that day.
Wind Scale of Beaufort (bft)
The Beaufort wind scale (abbreviated by bft) indicates the speed of the wind and was established in 1805 by Irishman Francis Beaufort. The wind speed ranges from wind force 1 to wind force 12. The wind speed is determined during the day on open ground. For example, if wind force 5 is predicted, in practice it may be wind force 6 on open water and wind force 4 in sheltered terrain.